Do you live or want to live in Denver’s west side, 80219 to be specific? This is the market update you want to read.
Interesting Data
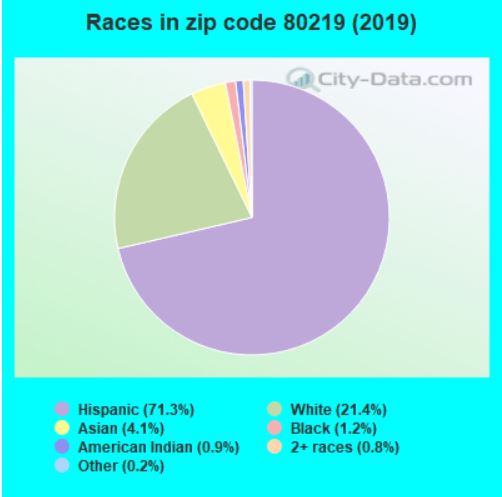
So let’s start first by looking at some interesting information about Denver’s 80219. The chart below shows that by far most homes were built in the 1950s. This will speak to the design and size of the homes that were common for that era. Also, the next graphic breaks down the population by demographics. According to the source, city-data.com, Hispanics account for 71.3% of the population followed by white 21.4%, and so on.
(Click to enlarge images)
Values Are Up
Just like many other places, the appreciation rates have been remarkable in recent years. For single-family homes, the median closed price has increased from around $235,000 to just under $350,000 in the last five years.
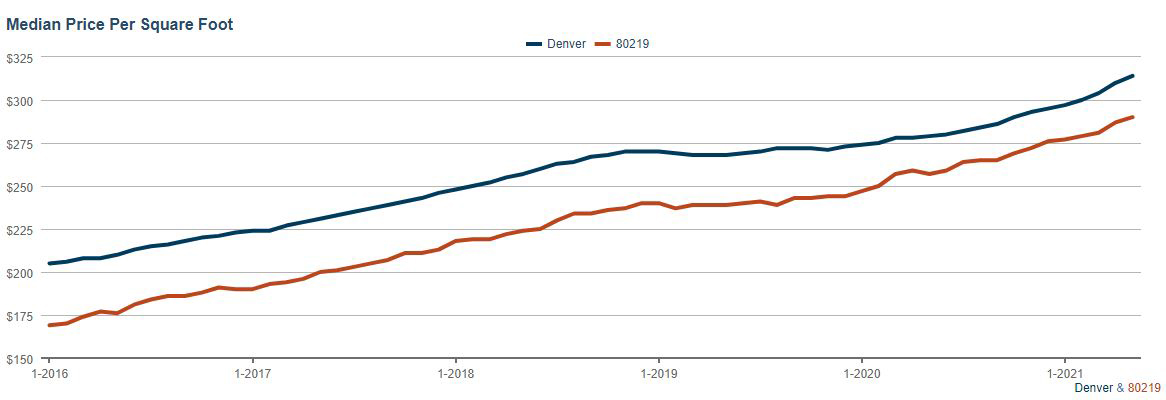
How does your home value compare to these prices? One way to get an idea of what your property value may be is to use a price per square feet calculation. For 80219, the median price per square foot (PSF) was at $290 for May. Overall for the city of Denver, the PSF was $314. Using this data, the estimated value of a home with 1200 sq.ft would be $348,000. This is not by any means what the value of your home would be but it gives you an idea.
Recent Solds
137 single family homes were sold between May 10 – June 10, . The median sold price was $432,000 which as 5.33% above asking and this was with only 4 days on the market.
Active Listings
Using a snapshot from June 10, 2021, there were 23 listings with a median listing price of $450,000. There is no mystery where prices continue to go — up, up, and up. Check out the map to see where these homes are located. They will more than likely be under contract or sold by the time you read this blog.
(Click to enlarge images)
Curious about what your home may sell for? Interested in buying in 80219? Reach out to me at my office 303-728-9433 or direct/text 720-724-8187.
You can also fill out the form below.
Data Source: REcolorado®, © 2010–2021 ShowingTime.


